Inkplate 13SPECTRA – Drawing colorful graphics
Inkplate 13SPECTRA allows you to draw colorful grahpics on a 1600 x 1200px canvas.
Adafruit GFX Library
The core graphics library for Inkplate library, created by Adafruit.
Color spectrum
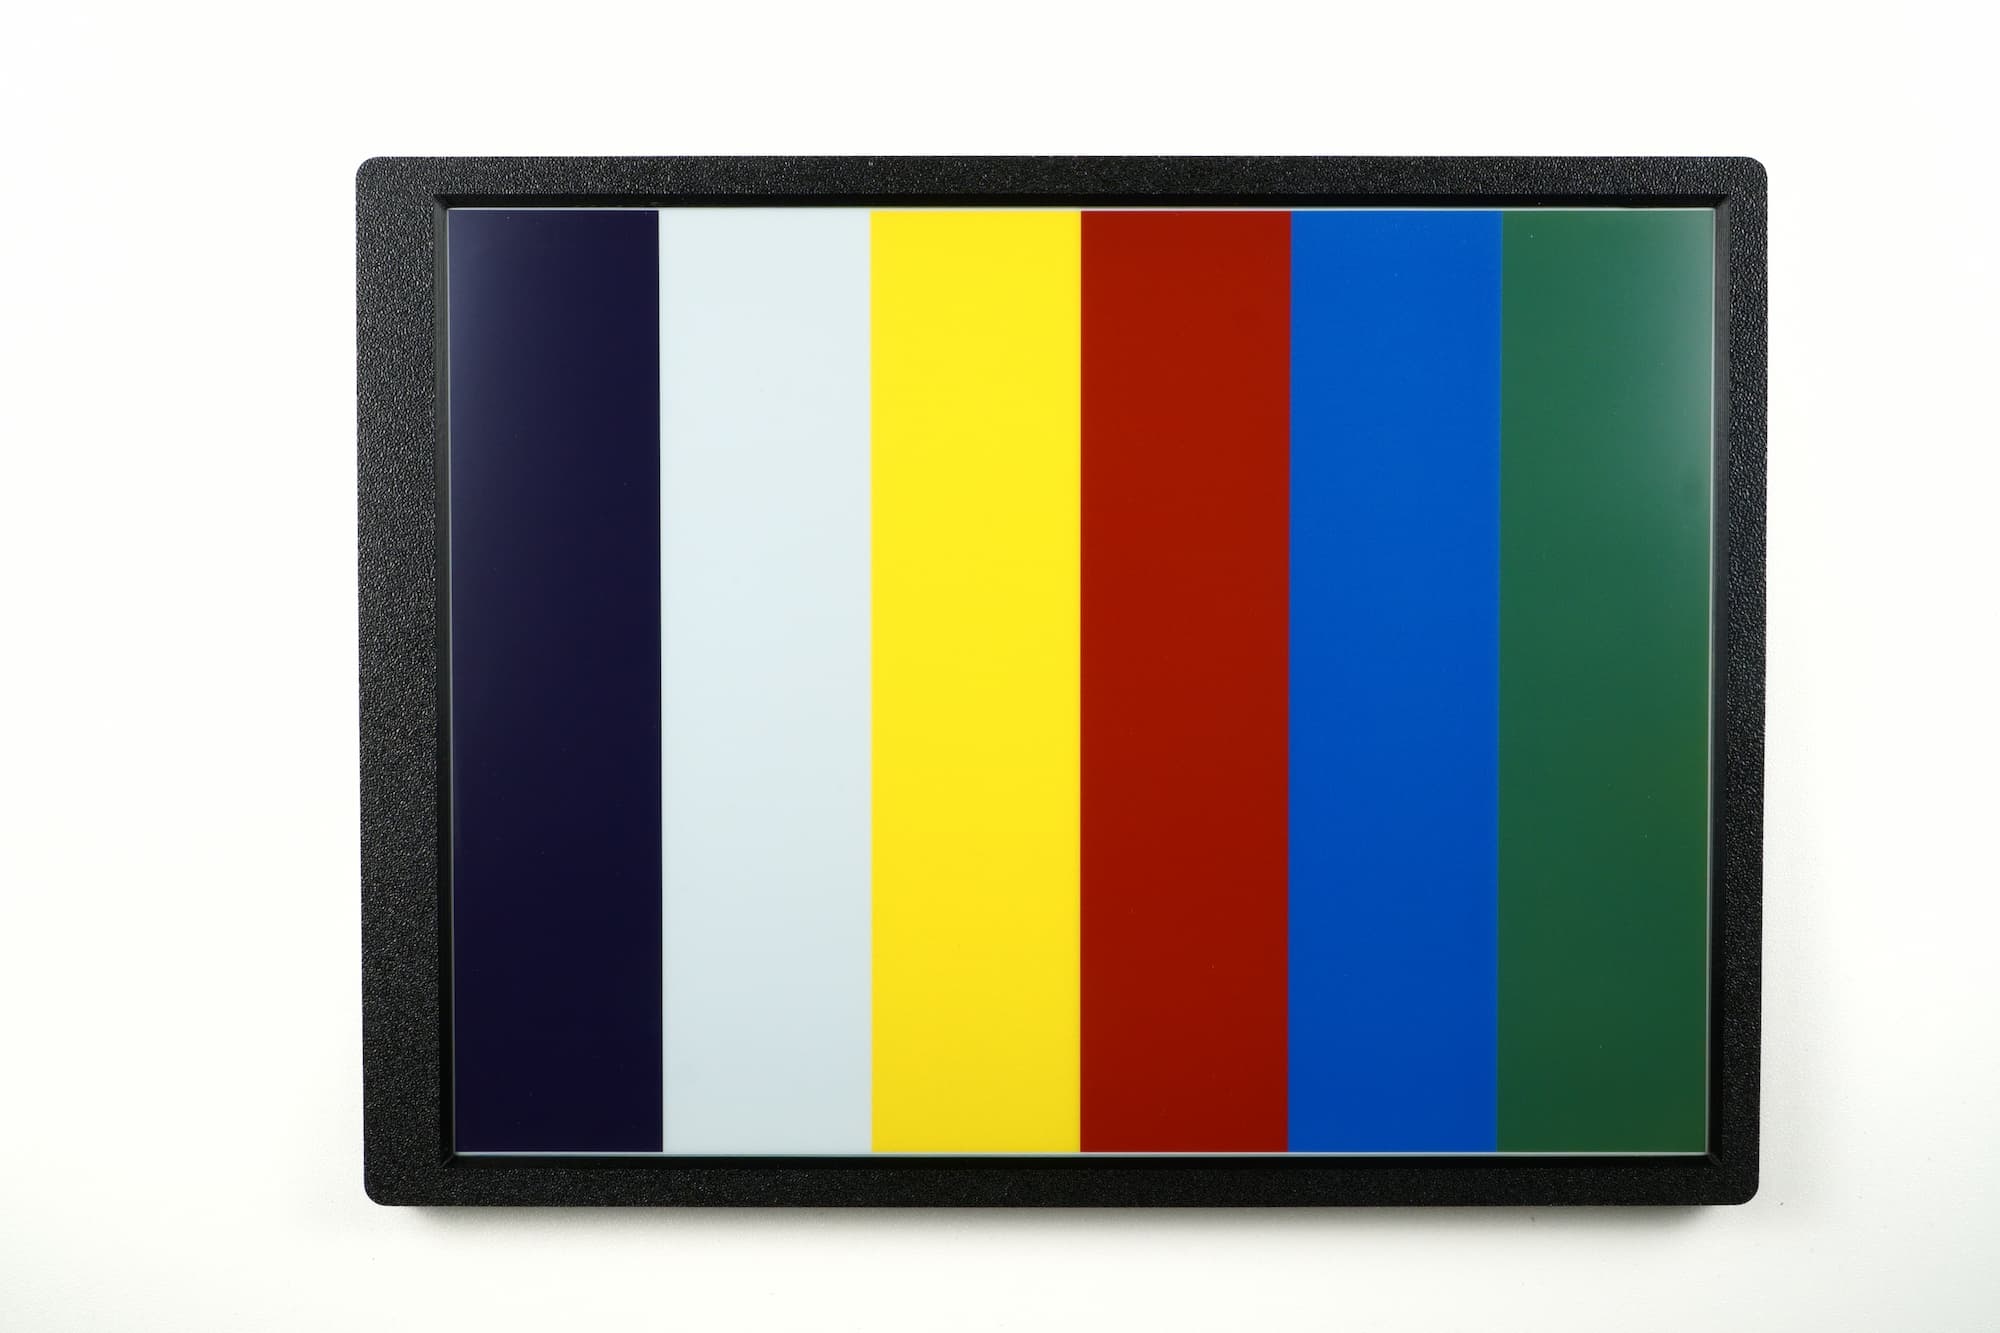
Below is an example demonstrating drawing in all available colors on the Inkplate 13SPECTRA:
INKPLATE_BLACK, INKPLATE_WHITE, INKPLATE_YELLOW, INKPLATE_RED, INKPLATE_BLUE, INKPLATE_GREENInkplate.h are currently incorrect for Inkplate 13SPECTRA: INKPLATE_BLUE and INKPLATE_GREEN need to be decremented by 1 to actually get those colors. Use INKPLATE_BLUE - 1 for blue and INKPLATE_GREEN - 1 for green, as shown in the examples below.The actual color order on Inkplate 13SPECTRA differs from the 6-color (6COLOR) Inkplate displays. This also affects the online image converter tool, which currently uses the 6COLOR palette indices for 13SPECTRA. The correct mapping is:
| Index | 13SPECTRA color | 6COLOR color |
|---|---|---|
| 0 | Black | Black |
| 1 | White | White |
| 2 | Yellow | Green |
| 3 | Red | Blue |
| 4 | Blue | Red |
| 5 | Green | Yellow |
#include "Inkplate.h"

// Declare Inkplate object
Inkplate display;

void setup(){
    // Initialize Inkplate
    display.begin();

    display.clearDisplay();
    // Draw a full screen of all colors
    display.fillRect(0, 0, 1600 / 6 + 2, 1200, INKPLATE_BLACK);
    display.fillRect(1 * 1600 / 6, 0, 1600 / 6 + 2, 1200, INKPLATE_WHITE);
    display.fillRect(2 * 1600 / 6, 0, 1600 / 6 + 2, 1200, INKPLATE_YELLOW);
    display.fillRect(3 * 1600 / 6, 0, 1600 / 6 + 2, 1200, INKPLATE_RED);
    display.fillRect(4 * 1600 / 6, 0, 1600 / 6 + 2, 1200, INKPLATE_BLUE-1);
    display.fillRect(5 * 1600 / 6, 0, 1600 / 6 + 2, 1200, INKPLATE_GREEN-1);

    // Show the Image on the screen
    display.display();
}

void loop(){
    // Loop forever
}
Below are the detailed references for these functions:
inkplate.fillRect()
Draws a filled rectangle on the display.
Returns value: none
Function parameters:
| Type | Name | Description |
|---|---|---|
int | x | The x-coordinate of the top-left corner. |
int | y | The y-coordinate of the top-left corner. |
int | width | The width of the rectangle. |
int | height | The height of the rectangle. |
uint8_t | color | The fill color. |
Drawing graphics
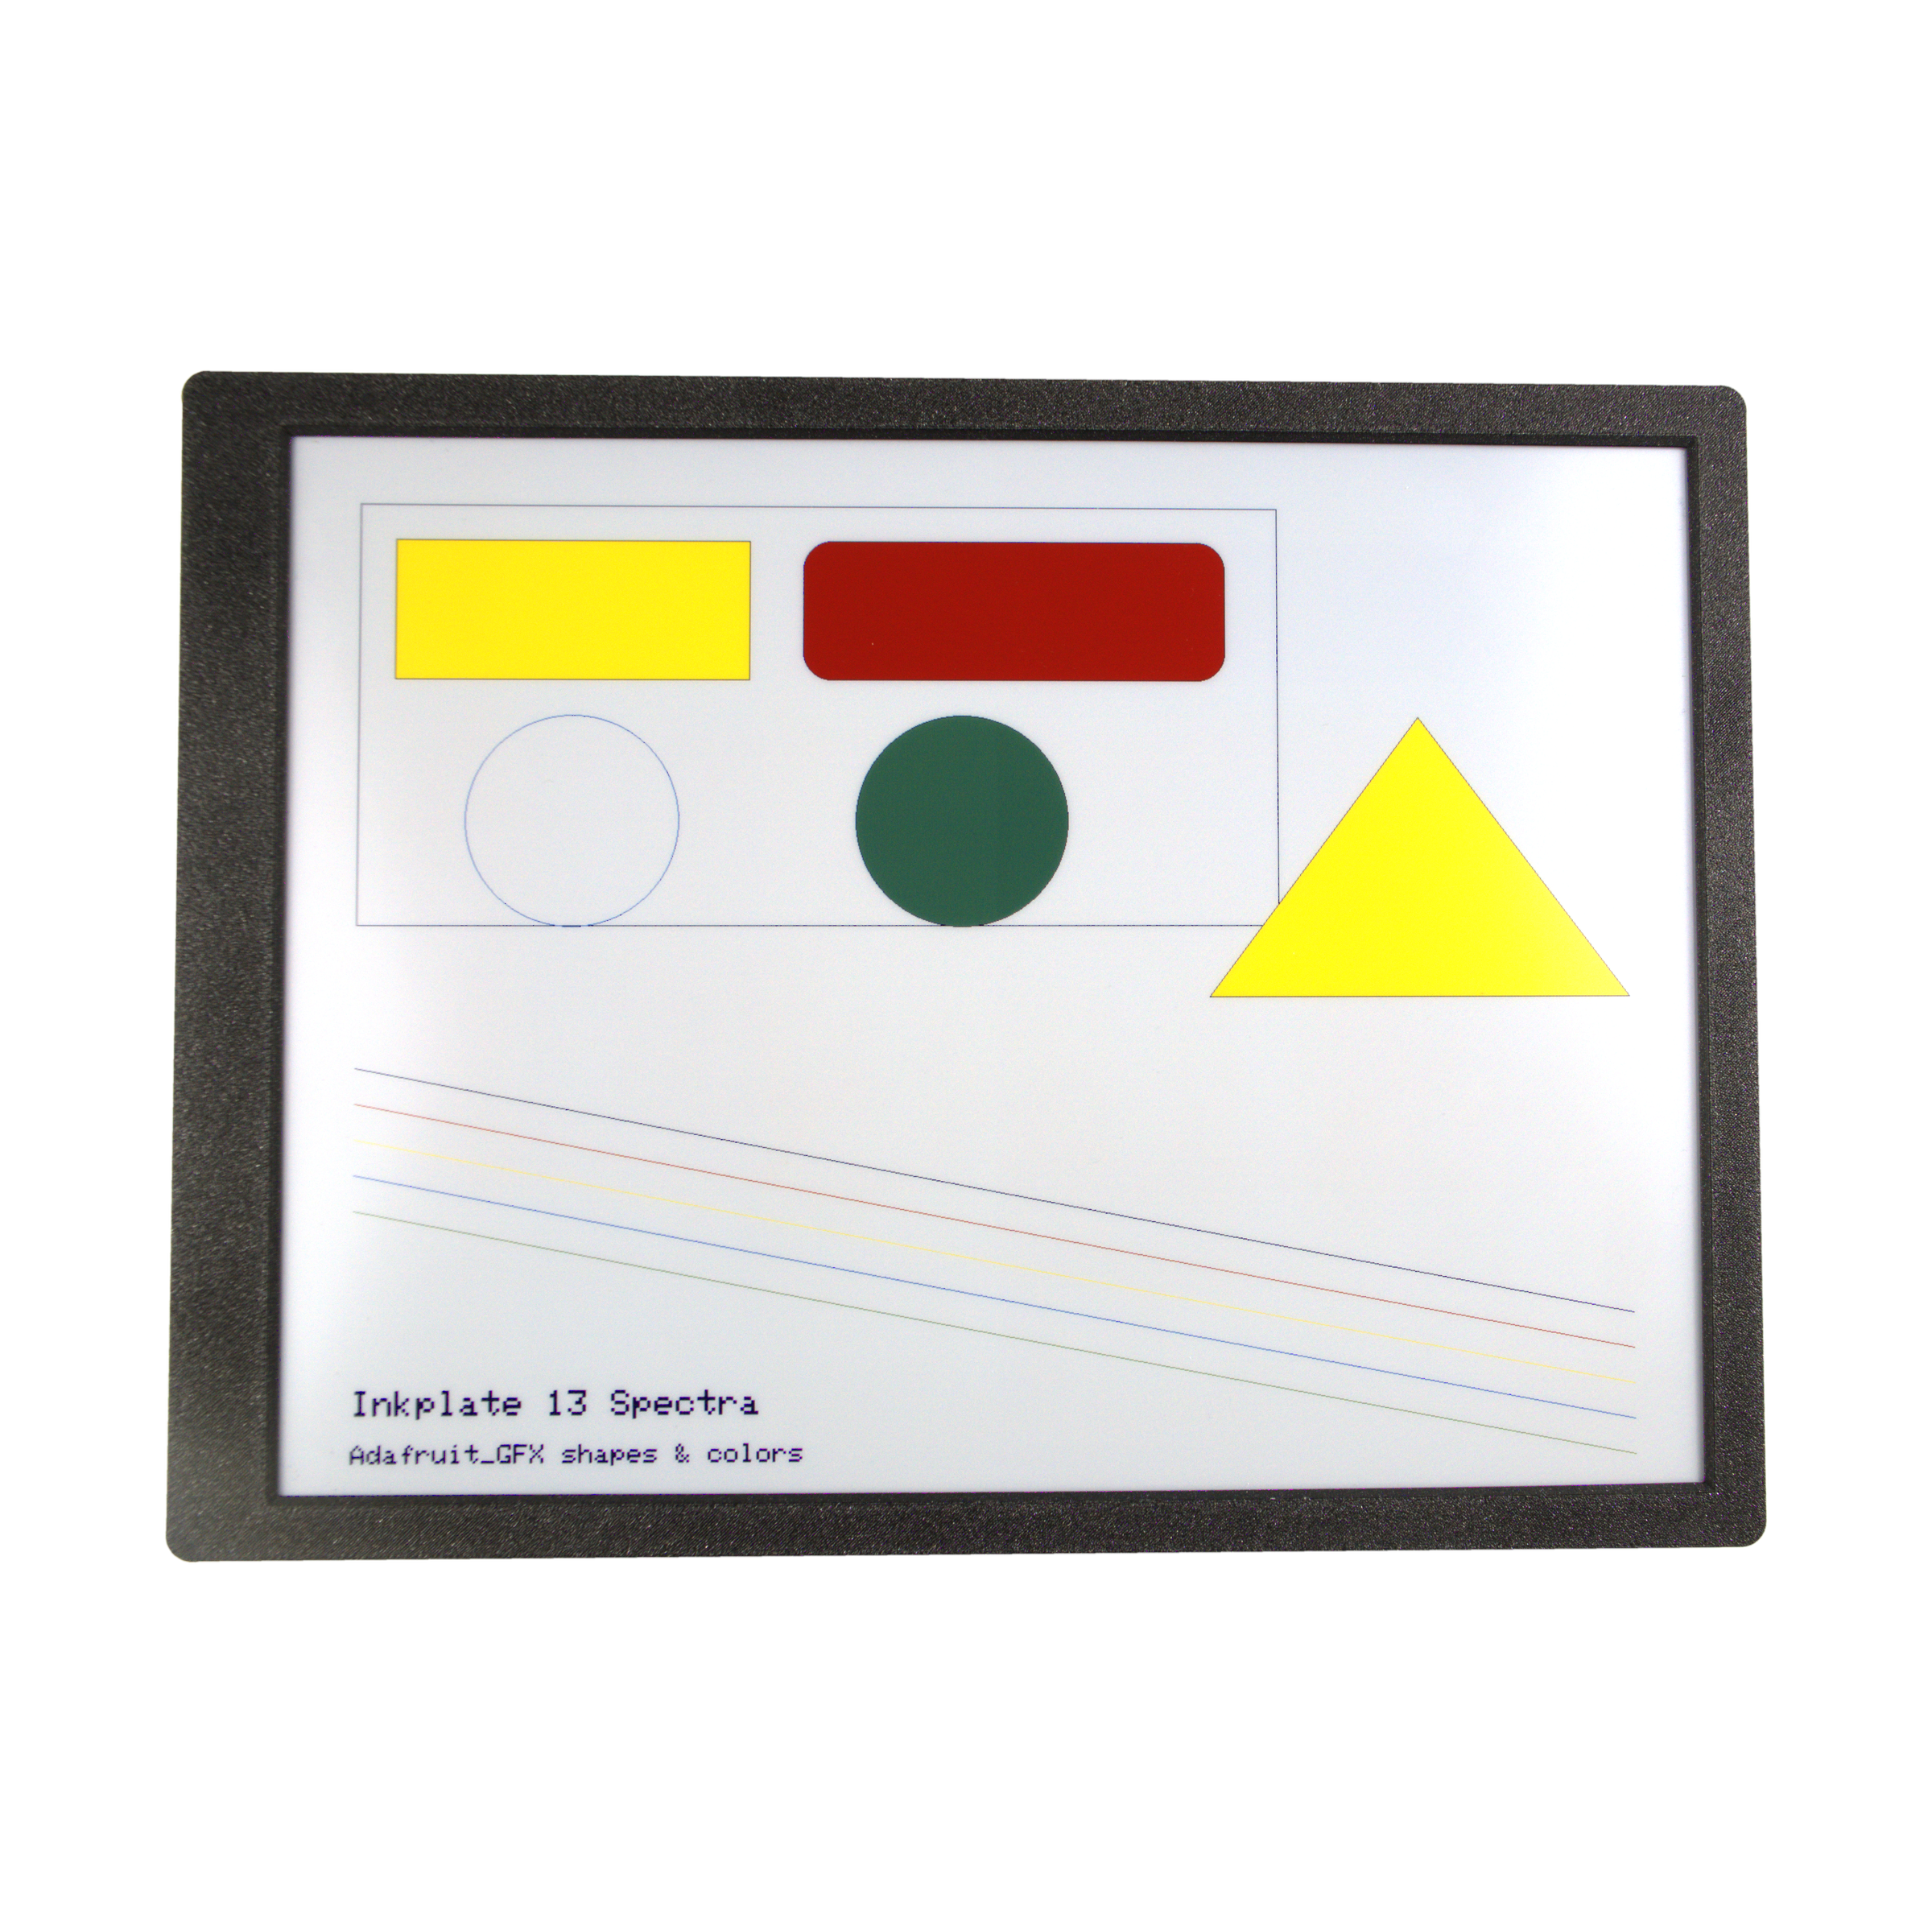
Below is an example demonstrating functions for drawing graphics on the Inkplate 13SPECTRA:
void setup(){
    display.clearDisplay();
    display.fillScreen(INKPLATE_WHITE);

    // Rectangles
    display.drawRect(40, 40, 520, 240, INKPLATE_BLACK);
    display.fillRect(60, 60, 200, 80, INKPLATE_YELLOW);
    display.drawRect(60, 60, 200, 80, INKPLATE_BLACK);
    display.fillRoundRect(290, 60, 240, 80, 16, INKPLATE_RED);
    display.drawRoundRect(290, 60, 240, 80, 16, INKPLATE_BLACK);

    // Circles
    display.drawCircle(160, 220, 60, INKPLATE_BLUE - 1);
    display.fillCircle(380, 220, 60, INKPLATE_GREEN - 1);
    display.drawCircle(380, 220, 60, INKPLATE_BLACK);

    // Triangle
    display.fillTriangle(520, 320, 640, 160, 760, 320, INKPLATE_YELLOW);
    display.drawTriangle(520, 320, 640, 160, 760, 320, INKPLATE_BLACK);

    // Lines
    display.drawLine(40, 360, 760, 520, INKPLATE_BLACK);
    display.drawLine(40, 390, 760, 550, INKPLATE_RED);
    display.drawLine(40, 420, 760, 580, INKPLATE_YELLOW);
    display.drawLine(40, 450, 760, 610, INKPLATE_BLUE - 1);
    display.drawLine(40, 480, 760, 640, INKPLATE_GREEN - 1);

    // Simple text
    display.setTextSize(3);
    display.setTextColor(INKPLATE_BLACK);
    display.setCursor(40, 760);
    display.print("Inkplate 13SPECTRA");

    display.setTextSize(2);
    display.setCursor(40, 800);
    display.print("Adafruit_GFX shapes & colors");

    // Update e-paper
    display.display();
}
Inkplate13SPECTRA_Drawing_Graphics.ino
Full example showing how to draw shapes, lines and text using the Adafruit GFX functions.
Below are the detailed references to these functions:
inkplate.drawRect()
Draws the outline of a rectangle on the display.
Returns value: none
Function parameters:
| Type | Name | Description |
|---|---|---|
int | x | The x-coordinate of the top-left corner. |
int | y | The y-coordinate of the top-left corner. |
int | width | The width of the rectangle. |
int | height | The height of the rectangle. |
uint16_t | color | The outline color. |
inkplate.fillRect()
Draws a filled rectangle on the display.
Returns value: none
Function parameters:
| Type | Name | Description |
|---|---|---|
int | x | The x-coordinate of the top-left corner. |
int | y | The y-coordinate of the top-left corner. |
int | width | The width of the rectangle. |
int | height | The height of the rectangle. |
uint16_t | color | The fill color. |
inkplate.drawRoundRect()
Draws the outline of a rectangle with rounded corners.
Returns value: none
Function parameters:
| Type | Name | Description |
|---|---|---|
int | x | The x-coordinate of the top-left corner. |
int | y | The y-coordinate of the top-left corner. |
int | width | The width of the rectangle. |
int | height | The height of the rectangle. |
int | radius | The radius of the rounded corners. |
uint16_t | color | The outline color. |
inkplate.fillRoundRect()
Draws a filled rectangle with rounded corners.
Returns value: none
Function parameters:
| Type | Name | Description |
|---|---|---|
int | x | The x-coordinate of the top-left corner. |
int | y | The y-coordinate of the top-left corner. |
int | width | The width of the rectangle. |
int | height | The height of the rectangle. |
int | radius | The radius of the rounded corners. |
uint16_t | color | The fill color. |
inkplate.drawTriangle()
Draws the outline of a triangle using three points.
Returns value: none
Function parameters:
| Type | Name | Description |
|---|---|---|
int | x0 | The x-coordinate of the first vertex. |
int | y0 | The y-coordinate of the first vertex. |
int | x1 | The x-coordinate of the second vertex. |
int | y1 | The y-coordinate of the second vertex. |
int | x2 | The x-coordinate of the third vertex. |
int | y2 | The y-coordinate of the third vertex. |
uint16_t | color | The outline color. |
inkplate.fillTriangle()
Draws a filled triangle using three points.
Returns value: none
Function parameters:
| Type | Name | Description |
|---|---|---|
int | x0 | The x-coordinate of the first vertex. |
int | y0 | The y-coordinate of the first vertex. |
int | x1 | The x-coordinate of the second vertex. |
int | y1 | The y-coordinate of the second vertex. |
int | x2 | The x-coordinate of the third vertex. |
int | y2 | The y-coordinate of the third vertex. |
uint16_t | color | The fill color. |
inkplate.drawLine()
Draws a straight line between two points.
Returns value: none
Function parameters:
| Type | Name | Description |
|---|---|---|
int | x0 | The x-coordinate of the starting point. |
int | y0 | The y-coordinate of the starting point. |
int | x1 | The x-coordinate of the ending point. |
int | y1 | The y-coordinate of the ending point. |
uint16_t | color | The line color. |
inkplate.drawPixel()
Draws a single pixel at the specified coordinates.
Returns value: none
Function parameters:
| Type | Name | Description |
|---|---|---|
int | x | The x-coordinate of the pixel. |
int | y | The y-coordinate of the pixel. |
uint16_t | color | The pixel color. |
Full examples
For the full working code example of the color spectrum demo above, see the link below:
Inkplate13SPECTRA_Full_Screen_Colors.ino
Full example of drawing a full screen of all available colors on Inkplate 13SPECTRA.